Ritchie is a Data Scientist & Big Data Engineer at Xomnia. Besides working at Xomnia, he writes blogs on his website about all kinds of machine- and deep learning topics, such as: “Assessing road safety with computer vision” and “Computer build me a bridge”. Expect more interesting blogs from Ritchie in the future.
K-Means Clustering
On a project I worked on at the ANWB (Dutch roadside assistance company) we mined driving behavior data. We wanted to know how many people were likely to drive a certain vehicle on a regular basis. Naturally, k-means clustering came to mind. The k-means algorithm finds clusters with the least inertia for a given k. A drawback is that often, k is not known. For the question about the numbers of persons driving a car, this isn’t that big of a problem as we have a good estimate of what k should be. The number of people driving on a regular basis would probably be in a range of 1 to 4. Nevertheless, this did make me wonder if there were algorithms that would define k for me. This blog post will go through the implementation of a clustering technique called ‘Affinity Propagation’. We will implement the algorithm in two ways. In some more readable syntax, to get an idea of what the algorithm is doing. And in a vectorized syntax, to fully utilize the speed advantages of NumPy .
Affinity Propagation
Affinity Propagation is a clustering method that next to qualitative cluster, also determines the number of clusters, such as k for you. Let’s walk through the implementation of this algorithm, to see how it works. As it is a clustering algorithm, we also give it random data to cluster so it can go crazy with its OCD.
# all the imports needed for this blog
import numpy as np
import matplotlib.pyplot as plt
from itertools import cycle

n = 20
size = (n, 2)
np.random.seed(3)
x = np.random.normal(0, 1, size)

for i in range(4):
    center = np.random.rand(2) * 10
        x = np.append(x, np.random.normal(center, .5, size), axis=0)

            c = [c for s in [v * n for v in 'bgrcmyk'] for c in list(s)]

            plt.figure(figsize=(15, 6))
            plt.title('Some clusters in 2d space')
            plt.scatter(x[:, 0], x[:, 1], c=c)
            plt.show()

In Affinity Propagation the data points can be seen as a network where all the data points send messages to all other points. The subject of these messages are the willingness of the points being exemplars. Exemplars are points that explain the other data points ‘best’ and are the most significant of their cluster. In addition, a cluster only has one exemplar. All the data points want to collectively determine which data points are an exemplar for them. These messages are stored in two matrices.
- The ‘responsibility’ matrix R. In this matrix, $r(i, k)$ reflects how well-suited point $k$ is to be an exemplar for point $i$.
- The ‘availability’ matrix A. $a(i, k)$ reflects how appropriate it would be for point $i$ to choose point $k$ as its exemplar.
Both matrices can be interpreted as log probabilities and are thus negative valued. Those two matrices actually represent a graph where every data point is connected with all other points. For five data points we could imagine a graph as seen below.

Figure 1 Graph of five data points.
This network can be encoded in a matrix where every index $i, k$ is a connection between two points.

Similarity
The algorithm converts through iteration. The first messages sent per iteration, are the responsibilities. These responsibility values are based on a similarity function $s$. The similarity function used by the authors is the negative euclidian distance squared.

We can simply implement this similarity function and define a similarity matrix $S$, which is a graph of the similarities between all the points. We also initialize the $R$ and $A$ matrix to zeros.
def similarity(xi, xj):
    return -((xi - xj)**2).sum()

def create_matrices():
    S = np.zeros((x.shape[0], x.shape[0]))
    R = np.array(S)
    A = np.array(S)

    # compute similarity for every data point.
    for i in range(x.shape[0]):
        for k in range(x.shape[0]):
            S[i, k] = similarity(x[i], x[k])

    return A, R, S
Responsibility
The responsibility messages are defined by:

We could implement this with a nested for loop where we iterate over every row $i$ and then determine the $\max(A + S)$ (of that row) for every index not equal to $k$ or $i$ (The index should not be equal to $i$ as it would be sending messages to itself). The damping factor is just there for numerical stabilization and can be regarded as a slowly converging learning rate. The authors advised choosing a damping factor within the range of 0.5 to 1.
Nested implementation
def update_r(damping=0.9):
    global R
    for i in range(x.shape[0]):
        for k in range(x.shape[0]):
            v = S[i, :] + A[i, :]
            v[k] = -np.inf
            v[i]= -np.inf
            R[i, k] = R[i, k] * damping + (1 - damping) * (S[i, k] - np.max(v))
Iterating over every index with a nested for loop is of course a heavy operation. Let’s profile (time) the function and see if we can optimize it by vectorizing the loops.
A, R, S = create_matrices()
%timeit update_r()

>>> 41 ms ± 1.36 ms per loop (mean ± std. dev. of 7 runs, 10 loops each)
Ok, 41 ms is our baseline. That shouldn’t be too hard to beat. Note that $ s(i, k) $ in ( eq. 1.0 ) is already defined and is equal to our matrix S . The harder part is $\max\limits_{k’ s.t. k’ \neq k}{ a(i, k’) + s(i, k’) }$, but we can make this easier by ignoring the limitations on the max function for a while. Let’s first focus on the inner part of the max function.

v = S + A
rows = np.arange(x.shape[0])
As data points shouldn’t send messages to itself, fill the diagonal with negative infinity so it will never be identified as the maximum value.
np.fill_diagonal(v, -np.inf)Then we can determine the maximum value for all rows.
idx_max = np.argmax(v, axis=1)
first_max = v[rows, idx_max]
Note that almost all columns in a row have the same maximum row value. This is true for all but the maximum value itself. As the max function iterates over $k’$ where $k’$ is chosen so that $k’ \neq k$ The maximum value in a row may point to itself, but must choose the second maximum value. We can implement that by setting the indices where $k’ = k$ to negative infinity and determine the new maximum value per row.
v[rows, idx_max] = -np.inf
second_max = v[rows, np.argmax(v, axis=1)]
The final result for $ \max\limits_{k’ s.t. k’ \neq k}{ a(i, k’) + s(i, k’) } $ can now be determined by broadcasting the maximum value per row to a symmetrical square matrix and replacing the indices holding the maximum value of the matrix $v$ ( eq. 1.1 ) with the second maximum value.
max_matrix = np.zeros_like(R) + first_max[:, None]
max_matrix[rows, idx_max] = second_max

new_val = S - max_matrix
Putting it together in one function results in:
Vectorized implementation
def update_r(damping=0.9):
    global R
    # For every column k, except for the column with the maximum value the max is the same.
    # So we can subtract the maximum for every row,
    # and only need to do something different for k == argmax

    v = S + A
    rows = np.arange(x.shape[0])
    # We only compare the current point to all other points,
    # so the diagonal can be filled with -infinity
    np.fill_diagonal(v, -np.inf)

    # max values
    idx_max = np.argmax(v, axis=1)
    first_max = v[rows, idx_max]

    # Second max values. For every column where k is the max value.
    v[rows, idx_max] = -np.inf
    second_max = v[rows, np.argmax(v, axis=1)]

    # Broadcast the maximum value per row over all the columns per row.
    max_matrix = np.zeros_like(R) + first_max[:, None]
    max_matrix[rows, idx_max] = second_max

    new_val = S - max_matrix

    R = R * damping + (1 - damping) * new_val
If we time this new function implementation we find an average execution time of 76 microseconds, which is more than 500x faster than our original implementation.
A, R, S = create_matrices()
%timeit update_r()

75.7 µs ± 674 ns per loop (mean ± std. dev. of 7 runs, 10000 loops each)
Availability
The availability messages are defined by the following formulas. For all points not on the diagonal of A (all the messages going from one data point to all other points), the update is equal to the responsibility that point $k$ assigns to itself and the sum of the responsibilities that other data points (except the current point) assign to $k$. Note that, due to the min function, this holds only true for negative values.

For points on the diagonal of A (the availability value that a data point sends to itself), the message value is equal to the sum of all positive responsibility values send to the current data point.

These two formulas are implemented in the following function.
Nested implementation
def update_a(damping=0.9):
    global A
    for i in range(x.shape[0]):
        for k in range(x.shape[0]):
            a = np.array(R[:, k]) # Select column k
            # All indices but the diagonal
            if i != k:
                a[i] = -np.inf
                a[k] = - np.inf
                a[a < 0] = 0
                A[i, k] = A[i, k] * damping + (1 - damping) * min(0, R[k, k] + a.sum())
            # The diagonal
            else:
                a[k] = -np.inf
                a[a < 0] = 0
                A[k, k] = A[k, k] * damping + (1 - damping) * a.sum()
This function works and is pretty readable. However let’s go through the optimization process again and try to vectorize the logic above, exchanging readability for performance in doing so. The current execution time is 53 milliseconds.
A, R, S = create_matrices()
%timeit update_a()

>>> 52.5 ms ± 375 µs per loop (mean ± std. dev. of 7 runs, 10 loops each)
First let’s focus on the $ \sum\limits_{i’ s.t. i’ \notin \{i, k\}}{\max\{0, r(i’, k) \}} $ part of eq. 2.0 . We first copy matrix R as we will be modifying this to determine the sum we just mentioned. The sum is only over the positive values, so we can clip the negative values and change them to zero. If we later sum over the whole array, these zero valued indices won’t influence the result.
a = np.array(R)
a[v < 0] = 0
The sum is over all indices $ i’ $ such that $ i’ \notin \{i, k\} $. The part $i’ \neq k$ is easy. This means that the diagonal $ r(k, k) $ is not included in the sum.
np.fill_diagonal(a, 0)
The part $i’ \neq i$ is harder, as $i$ is the index the sum iterates over. This means that for every index $i$ the same index is excluded. This is harder to vectorize. However, we can get around this by first including it in the sum, and finally subtracting the value for every index $r(i, k)$. In the code below we also add the $ r(k, k) $. We will have defined the $ r(k,k) + \sum\limits_{i’ s.t. i’ \notin \{i, k\}}{\max\{0, r(i’, k)\}} $ part of eq.2.0 . These sums are the same for every row in the matrix. The 1D sum vector can be broadcasted to a matrix with the shape of A. Once we have reshaped by broadcasting we subtract positive values we unjustly included in the sum.
# diagonal k, k
k_k_idx = np.arange(x.shape[0])

a = a.sum(axis=0)
a = a + R[k_k_idx, k_k_idx]

a = np.ones(A.shape) * a # reshape to a square matrix
a -= np.clip(R, 0, np.inf) # subtract the values that should not be included in the sum
In eq. 2.0 the final result is the minimum of 0 and what we’ve just computed. So we can clip the values larger than 0.
# a(i, k)
a[a < 0] = 0
For eq. 2.1 vectorizing is slightly easier. We make another copy of R and we note that we again should include only positive values in our sum where $i’ \neq k$. We can set the diagonal of our copy to zero so it has no influence on the sum and we can clip the negative values to zero.
np.fill_diagonal(w, 0)
w[w < 0] = 0
With all the zeros on the right places we can now compute the sum and add it to the diagonal of a (this is $a(k, k) $).
a[k_k_idx, k_k_idx] = w.sum(axis=0)
Combining it all in one function we’ll get:
Vectorized implementation
def update_a(damping=0.9):
    global A

    k_k_idx = np.arange(x.shape[0])
    # set a(i, k)
    a = np.array(R)
    a[a < 0] = 0
    np.fill_diagonal(a, 0)
    a = a.sum(axis=0) # columnwise sum
    a = a + R[k_k_idx, k_k_idx]

    # broadcasting of columns 'r(k, k) + sum(max(0, r(i', k))) to rows.
    a = np.ones(A.shape) * a

    # For every column k, subtract the positive value of k.
    # This value is included in the sum and shouldn't be
    a -= np.clip(R, 0, np.inf)
    a[a > 0] = 0

    # set(a(k, k))
    w = np.array(R)
    np.fill_diagonal(w, 0)

    w[w < 0] = 0

    a[k_k_idx, k_k_idx] = w.sum(axis=0) # column wise sum
    A = A * damping + (1 - damping) * a
This vectorized function has an average execution time of 70 microseconds. This is approximately 590x faster than the nested implementation! Affinity Propagation has a complexity of $O(n^2)$. So with increasing data points the optimization isn’t a luxury.
Exemplars
The final examplars are chosen by the maximum value of $A + B$.

We implement this in a function where we immediately plot the final clustering result.
def plot_iteration(A, R):
    fig = plt.figure(figsize=(12, 6))
    sol = A + R
    # every data point i chooses the maximum index k
    labels = np.argmax(sol, axis=1)
    exemplars = np.unique(labels)
    colors = dict(zip(exemplars, cycle('bgrcmyk')))

    for i in range(len(labels)):
        X = x[i][0]
        Y = x[i][1]

        if i in exemplars:
            exemplar = i
            edge = 'k'
            ms = 10
        else:
            exemplar = labels[i]
            ms = 3
            edge = None
            plt.plot([X, x[exemplar][0]], [Y, x[exemplar][1]], c=colors[exemplar])
        plt.plot(X, Y, 'o', markersize=ms,  markeredgecolor=edge, c=colors[exemplar])


    plt.title('Number of exemplars: %s' % len(exemplars))
    return fig, labels, exemplars
Clustering
Now we have got everything set. We can execute this algorithm on our data that we generated earlier. The inputs for this algorithm are:
- The number of iterations. (Which should be chosen so that the exemplars don’t change, i.e. convergence is reached.)
- The damping factor. (Could be changed for faster iterations or more nummerical stability.)
- The preference.
The last input, the preference, is set to the diagonal of the $S$ matrix. This preference value indicates how strongly a data point thinks itself should be an exemplar. In our case, the maximum similarity value is an euclidian distance of 0, which already is the value of the diagonal of $S$. If we choose the leave this value unmodified. We will see almost no clustering as most data points choose to be an exemplar for themselves.
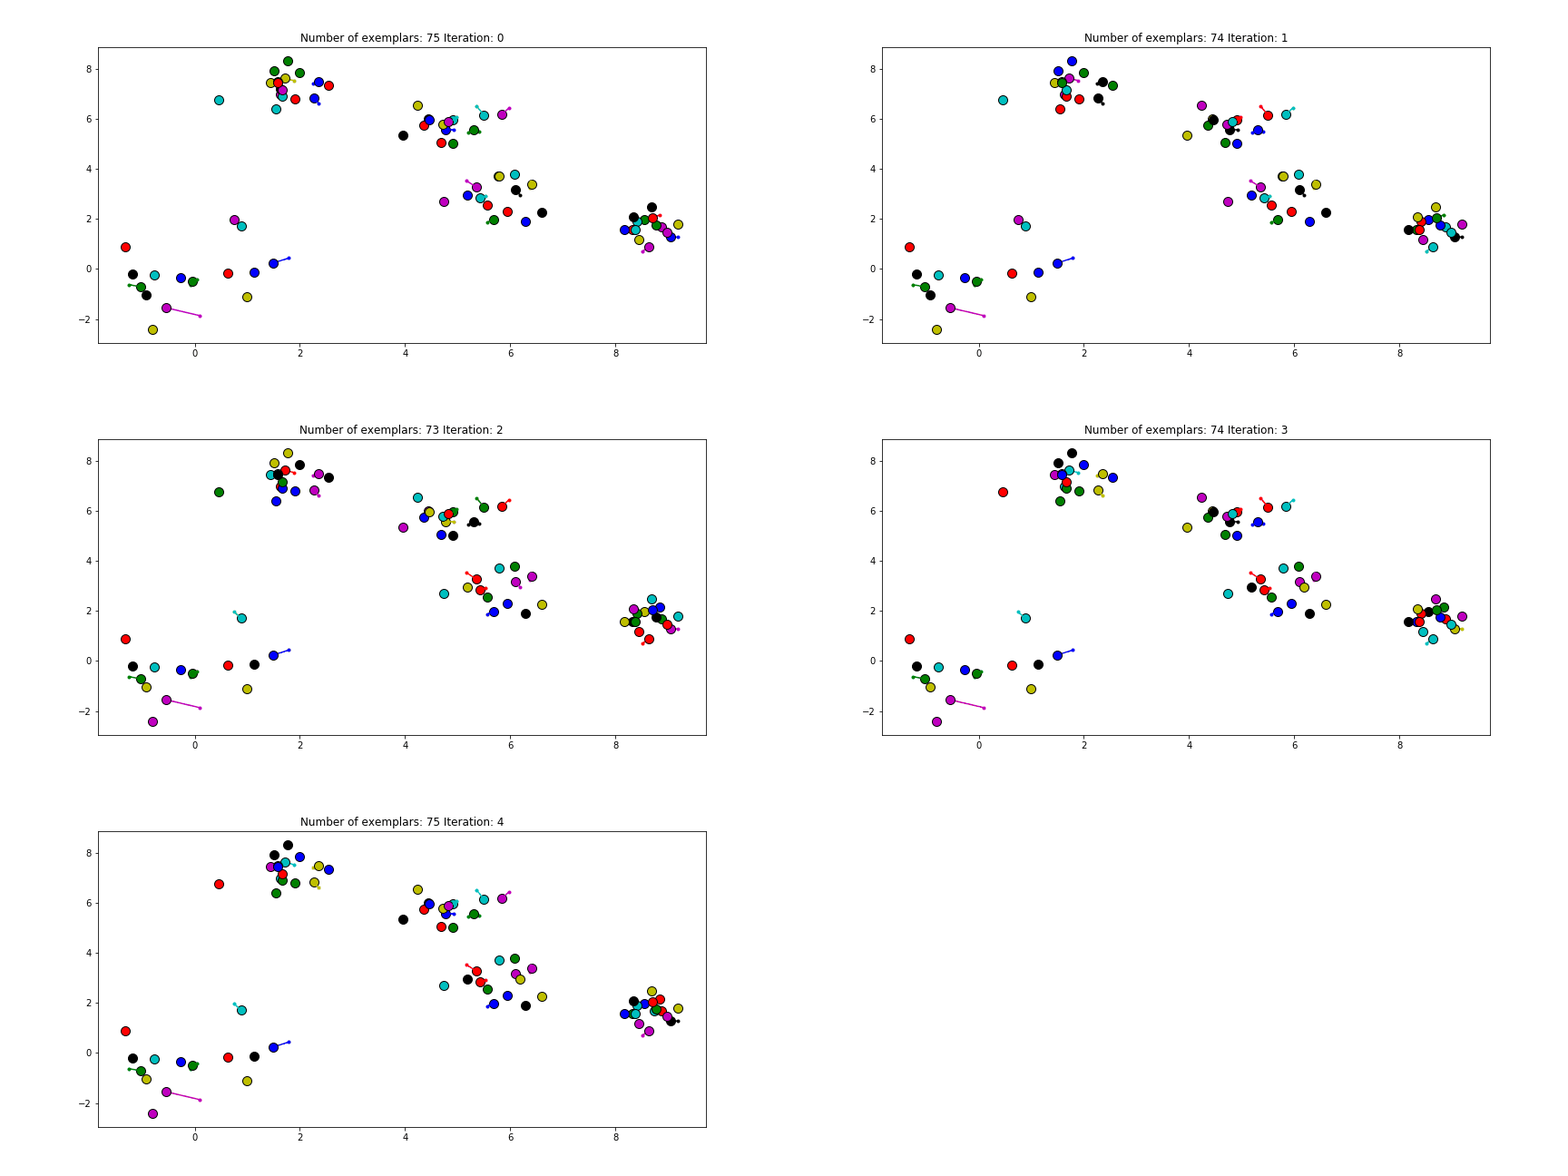
Figure 2.1 Clustering if a preference of 0 is chosen for all the data points.
Just as in the real world, when everybody is just thinking about themselves it doesn’t result in all too much concensus. If you haven’t got a priori knowledge of the data points it is advised to start with a preference equal to the median of $S$ (approximately -25 in our case). And let’s see how we set this preference input and actually do the clustering iterations!
A, R, S = create_matrices()
preference = np.median(S)
np.fill_diagonal(S, preference)
damping = 0.5

figures = []
last_sol = np.ones(A.shape)
last_exemplars = np.array([])

c = 0
for i in range(200):
    update_r(damping)
    update_a(damping)

    sol = A + R
    exemplars = np.unique(np.argmax(sol, axis=1))

    if last_exemplars.size != exemplars.size or np.all(last_exemplars != exemplars):
        fig, labels, exemplars = plot_iteration(A, R, i)
        figures.append(fig)

    if np.allclose(last_sol, sol):
        print(exemplars, i)
        break

    last_sol = sol
    last_exemplars = exemplars
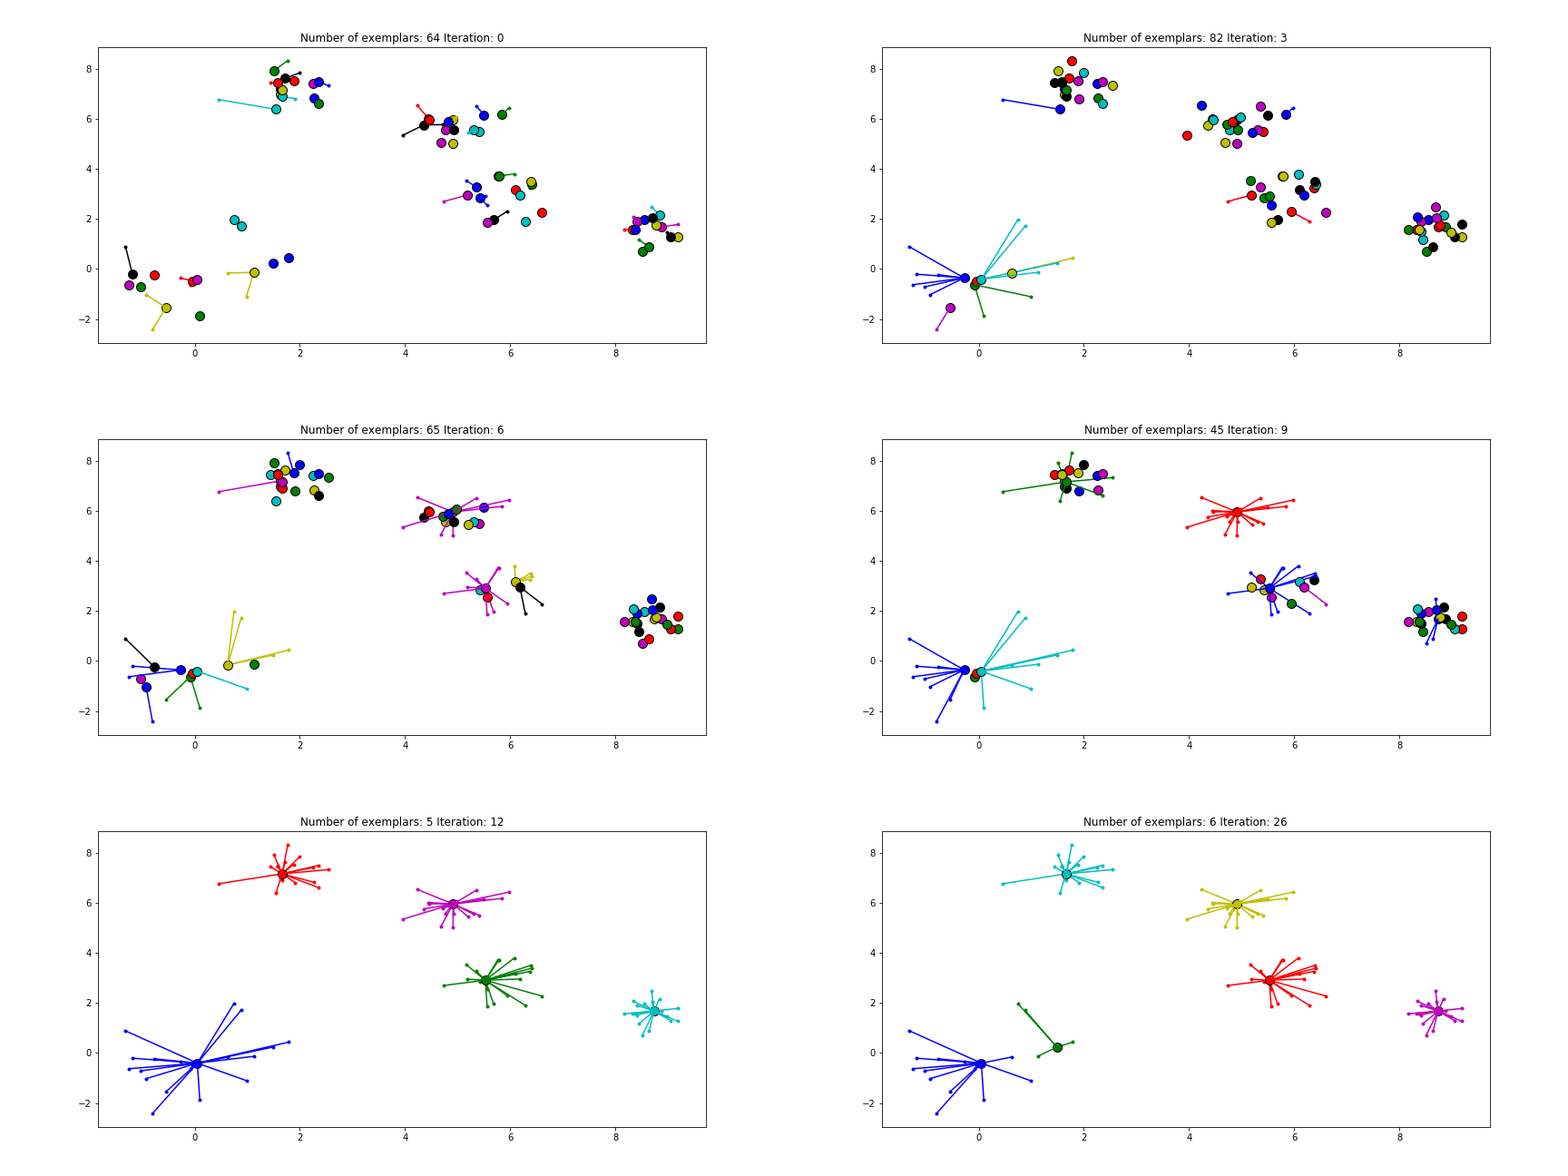
Figure 2.2 Clustering if a preference of $median(S)$ is chosen for all the data points.
We see that the algorithm finds one more cluster then defined in our original data set. The original blue cluster is split into two clusters. If we want Affinity Propagation to be less eager in splitting clusters we can set the preference value lower. If we choose a value of -70 we will find our original clusters.
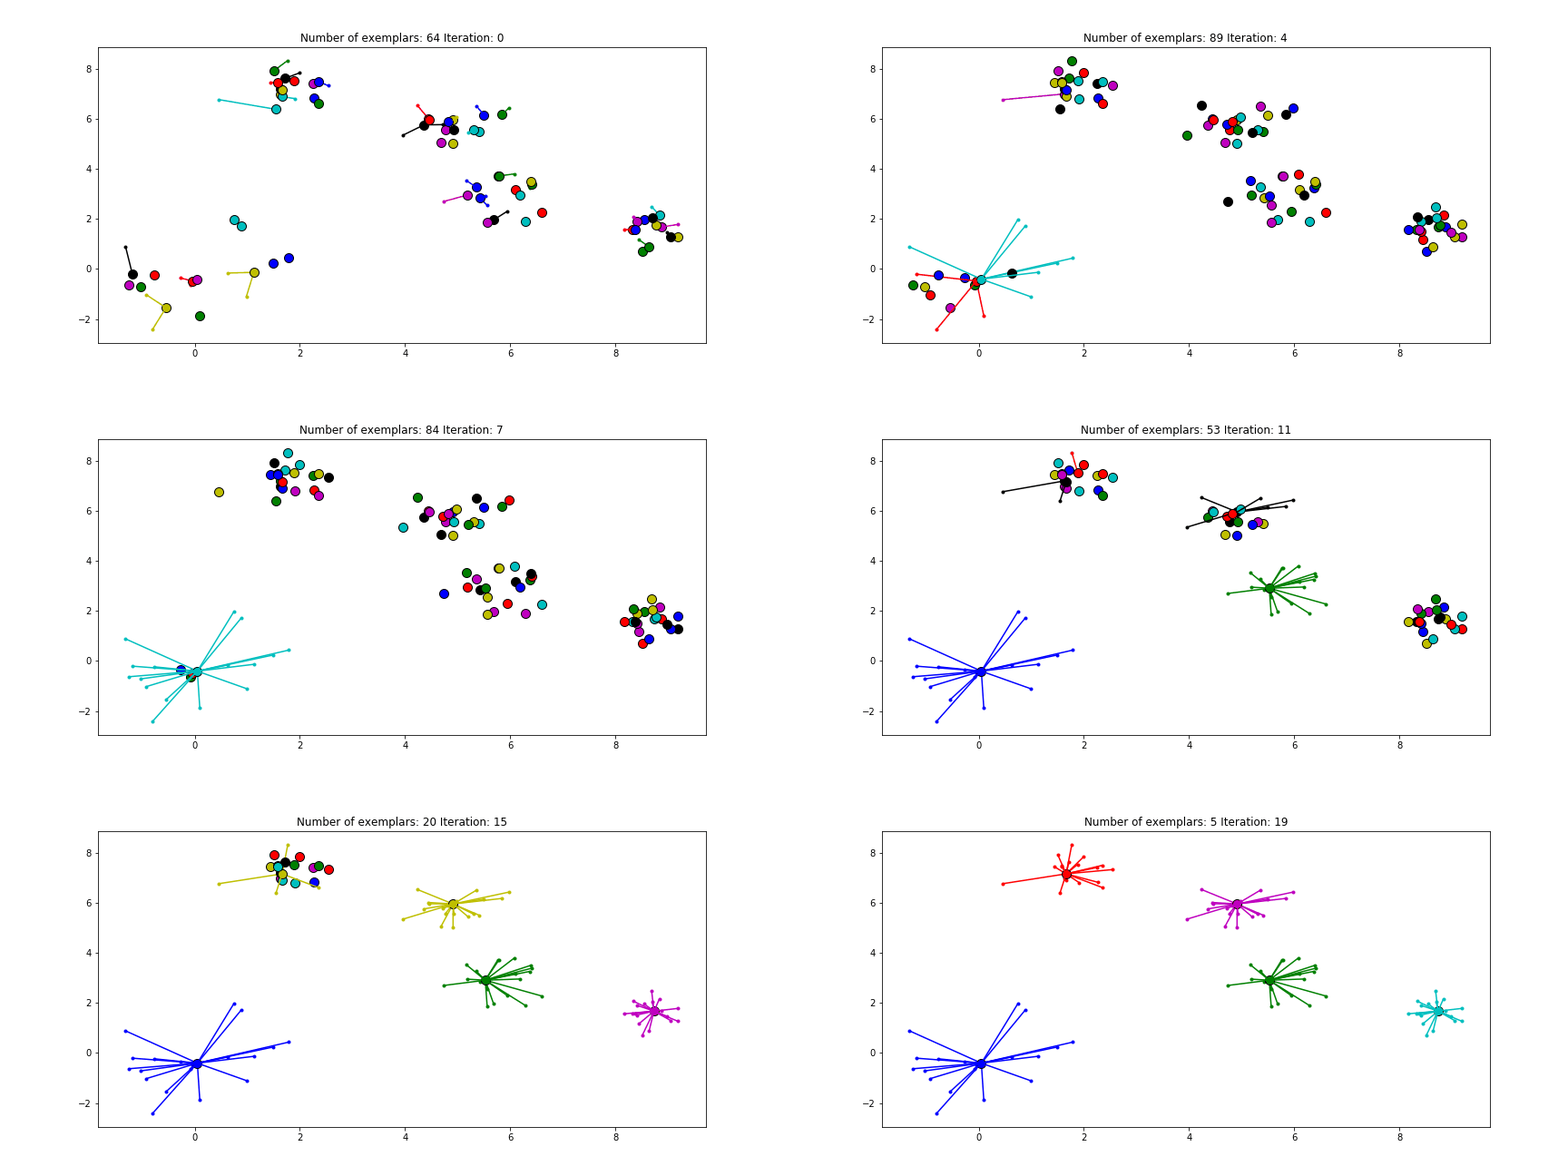
Figure 2.3 Clustering if a preference of -70 is chosen for all the data points.
And if we put this knowledge to the extreme and choose a preference of -1000, meaning that every data point is very likely to choose some other point to be their exemplar we’ll only find two clusters.
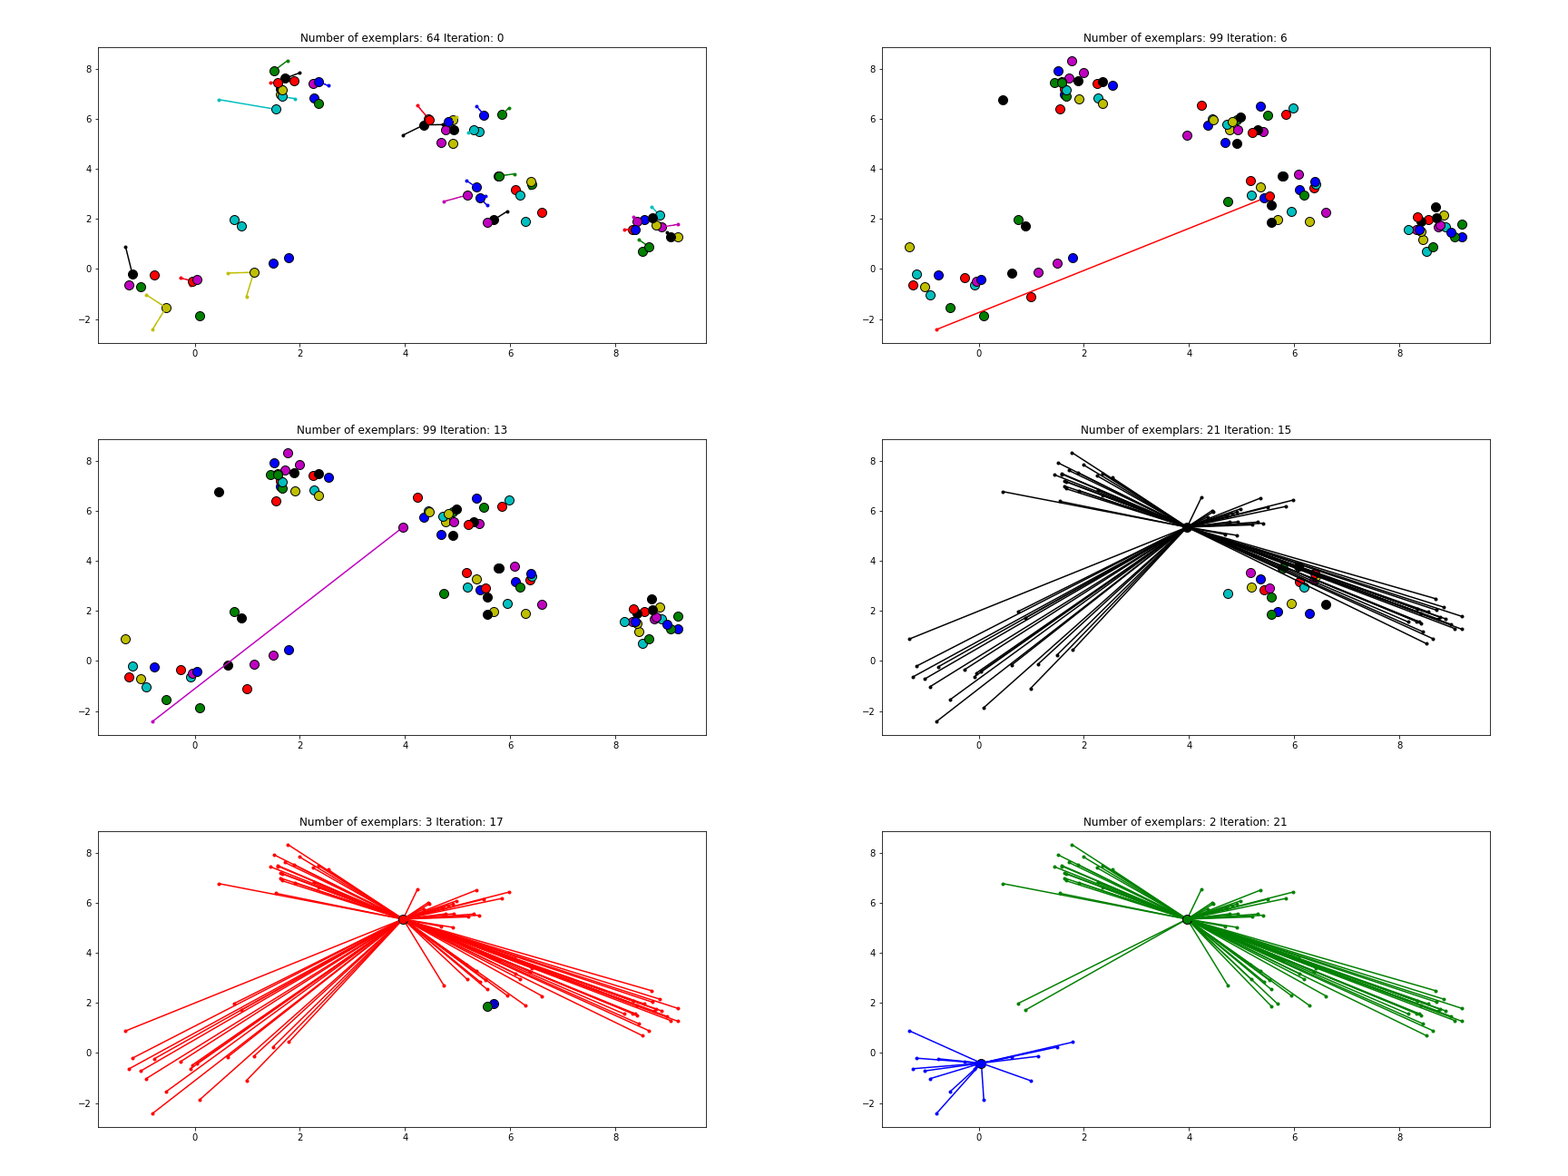
Figure 2.4 Clustering if a preference of -1000 is chosen for all the data points.
We can also give different preference values to certain data points. Below we have set the preference of all data points to $median(S)$ except for the original blue data points in the bottom left corner. These points have a preference of -200, meaning that they rather choose another point as their exemplar.
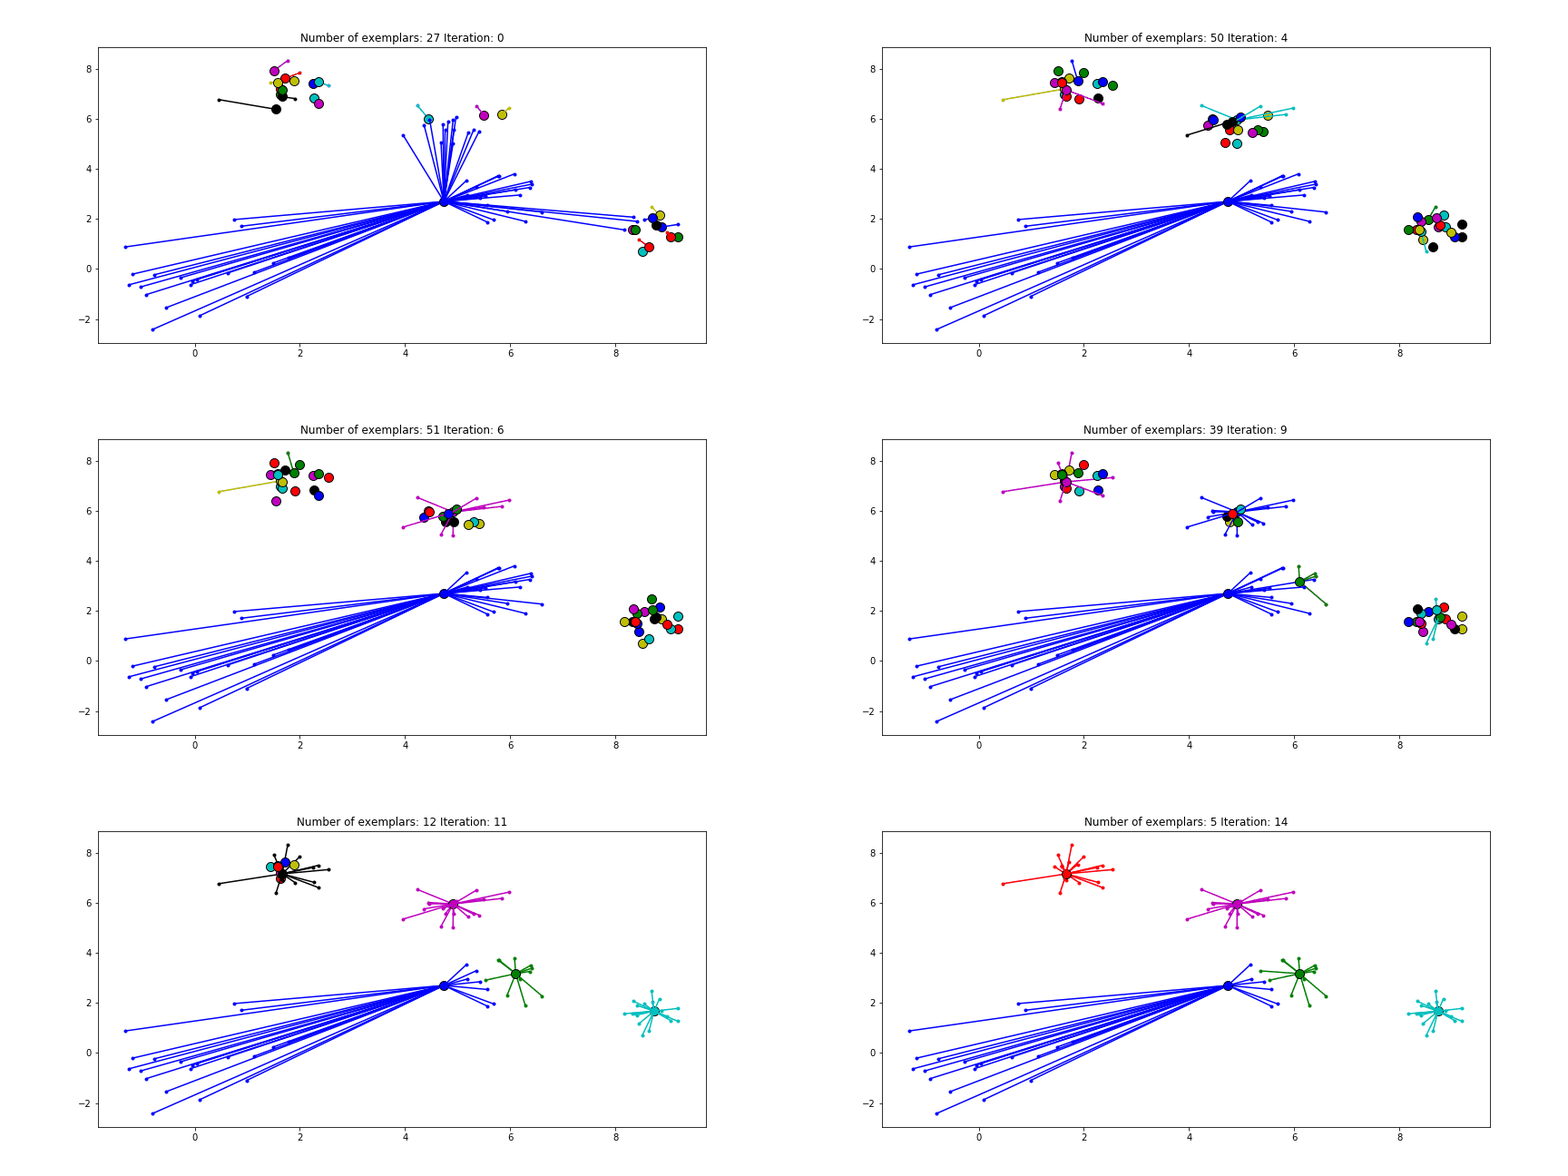
Figure 2.5 Clustering when a subset has a very low preference.
Summary
This post we dissected the Affinity Propagation algorithm. We’ve implemented the message exchanging formulas in a more readible but slower executing code and in a vectorized optimized code. This blog post is based on a jupyter notebook I’ve made, which can be found here! Wan’t to read more about other machine learning algorithms?
(c) 2018 Ritchie Vink.


