
In the early 18-th century, there was a recreational mathematical puzzle called the Königsberg bridge problem. The solution of this problem, though simple, opened the world to a new field in mathematics called graph theory. In today’s world, graph theory has expanded beyond mathematics into our everyday life without us even noticing.
In this blog, I will start by discussing the original problem and its clever solution. Then, I will lay down what graph theory is and its main components. Finally, I will conclude with 5 applications of graph theory that are used today in the world of data science.
Königsberg (now Kaliningrad, Russia) was a city from the old Kingdom of Prussia spanning along both sides of the Pregel river. The city had two islands that were connected to the mainland through bridges. The smaller island was connected with two bridges to either side of the river, while the bigger island was connected with only one. Additionally, there was one bridge connecting both islands. You can see the layout of the bridges in the image below.
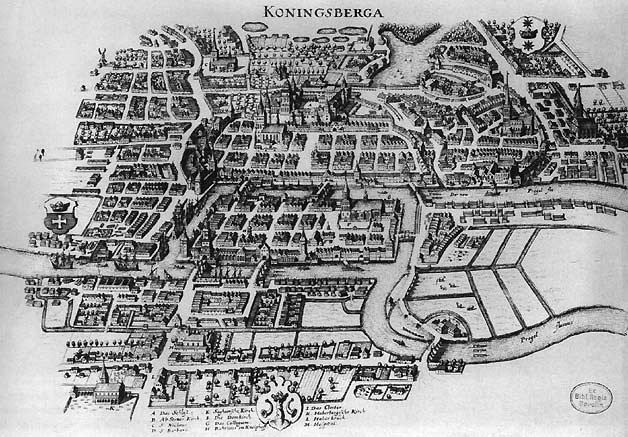
Image source: Merian-Erben
Now, imagine that you are a tourist and want to cross all 7 bridges because they are the main attraction of the city. However, you are a bit lazy and do not want to walk too much. So, you do not want to cross the same bridge more than one time. Is there a path through the city that does this? Just as a simple rule, you can only cross the river through bridges, so no swimming. How would you solve this problem?
Superficially, the problem sounds simple to solve. Just try some paths and you will arrive at the solution. However, no matter how many paths you try, you will not find a solution. Leonhard Euler, a famous mathematician, realized this, and explained why it was impossible to make this path through the city.
Firstly, he realized that it does not matter how you travel inside the city. The only important part to consider for the problem was the connections between the different landmasses. He drew dots to represent the landmasses and lines connecting these dots to represent the bridges (as seen in the picture below). The location of the dots and the shape of the lines are not relevant for the problem, only their relation. In the end, he had an abstraction of the problem with only dots and lines, which is now called a graph.
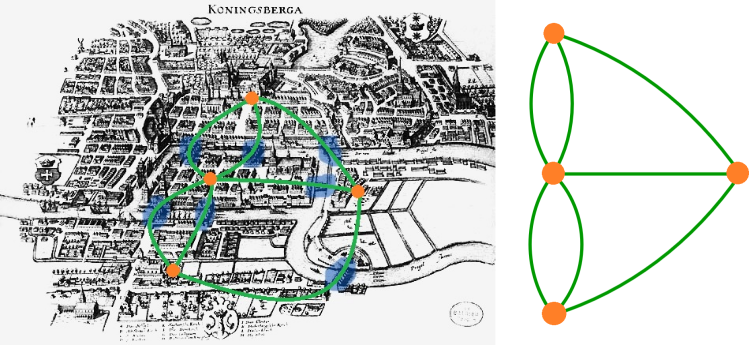
Second, he thought that in order to walk through a landmass you need to enter through a bridge and exit from a different bridge. This means that the dot representing that landmass needs two lines connecting it to represent the enter and exit line. More generally, the dot can have any even number of lines as connections. This does not necessarily apply for two dots, which are the first and last landmass in the path. Those dots can have an odd number of lines connecting them since you could only exit the first dot and only enter the last dot. From counting the lines connecting each dot of the Königsberg bridge problem, one can see that all of the landmasses have an odd number of connections. This proves that it is impossible to make a path that crosses through all bridges.
Euler changed the way of solving problems. He recognized that the problem was not about measuring and calculating the solution, but about finding the geometry and relations behind it. By abstracting the problem, he started the field of graph theory and his solution became the first theorem of this field. Since then, graph theory has developed not only from a mathematical perspective, but into many other fields such as physics, biology, linguistics, social sciences, computer sciences and more.
Join the leading data & AI consultancy in the Netherlands. Click here to view our vacancies
Graph theory is the study of relationships between objects. These objects can be represented as dots (like the landmasses above) and their relationships as lines (like the bridges). The dots are called vertices or nodes, and the lines are called edges or links. The connection of all the vertices and edges together is called a graph and can be represented as an image, like the ones below:
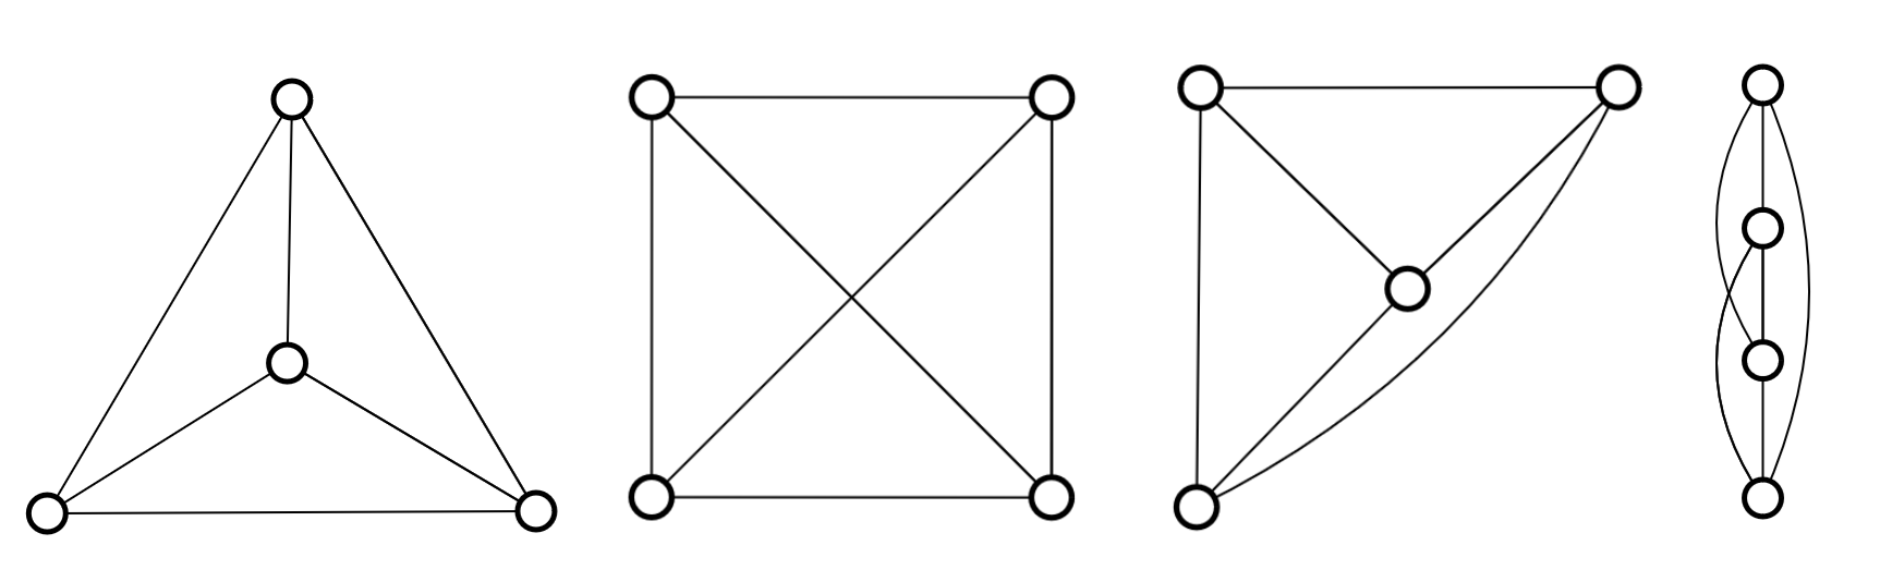
One of the most important properties of graphs is that they are just abstractions of the real world. This allows the representation of graphs in many different ways, all of which are correct. For example, all the graphs above are visually very different from each other; however, they all represent the same relations, thus all are the same graph. You can check it by counting the number of edges that each vertex has.
Graphs can be divided into many different categories based on their properties. The most common categories are directed and undirected graphs. Directed graphs have edges with specific orientations, normally shown as an arrow. For example, in a graph representing a cake recipe, each vertex is a different step in the recipe and the edges represent the relation between these steps. You can put the cake in the oven only after mixing the ingredients; therefore, there is a directed edge from the mixing to the baking step. Undirected graphs have symmetric edges, just like the ones shown earlier. Another example is the graph of a social network, where vertices represent people and edges connect people that have a relationship. These relationships go both ways.
Another important feature is that the vertices or the edges can have weights or labels. Let's assume that you are building a graph from a series of warehouses and stores in a city to optimize the supply of the stores. You can have two types of vertices, warehouses and stores, and the edges that connect them can be weighted by either the physical distance between the two locations or by the cost to move the product from one location to another. Weights and labels are very important when using graph theory in real life applications, since it is a way to add complexity to the simple graph model.
Read more: Anomaly detection using network science
For now, I have described what a graph is and its properties, but not how to use graph theory to solve problems. Interestingly, once abstracted to a graph, the problem falls into a few fundamental categories, such as path finding, graph coloring, flow calculation and more. In the next section, I will address some of these categories, some real-life problems that fall into them and how to abstract the problems into graphs.
In this section I present 5 different problems of graph theory with real life examples. The calculation of their solution can be done with a variety of algorithms that I encourage the reader to look up since they sometimes become highly complex for this introductory blog. Moreover, the solutions of such problems may not be unique nor exact. Graph theory algorithms depend on the size and complexity of the graph; this means that some solutions may just be a very good approximation to the exact solution. Even more, some problems have not even been solved, thus approximations are the best outcome.
One of the most popular applications of graph theory falls within the category of flow problems, which encompass real life scenarios like the scheduling of airlines. Airlines have flights all around the world and each flight requires an operating crew. Personnel might be based on a particular city, so not every flight has access to all personnel. In order to schedule the flight crews, graph theory is used.
For this problem, flights are taken as the input to create a directed graph. All serviced cities are the vertices and there will be a directed edge that connects the departure to the arrival city of the flight. The resulting graph can be seen as a network flow. The edges have weights, or flow capacities, equivalent to the number of crew members the flight requires. To complete the flow network a source and a sink vertex have to be added. The source is connected to the base city of the airline that provides the personnel and the sink vertex is connected to all destination cities.
Using graph theory, the airline can then calculate the minimum flow that covers all vertices, thus the minimum number of crew members that need to operate all flights. Additionally, by giving weights to the cities corresponding to its importance, the airline can calculate a schedule for a reduced number of crew members that do not necessarily visit all the cities.
This flow problem can also be applied to many other instances. For example, when having to supply stores from warehouses with a finite number of trucks, or when scheduling public transport in specific routes considering the expected amount of people that will be using it.
We're hiring! Join the leading data & AI consultancy in the Netherlands.
Nowadays, we use our smart phones all the time to help us in our everyday lives. For me, it helps me by giving me directions to cycle from my location to a restaurant or a bar. But how are these directions calculated? Graph theory is the answer for this challenge, which falls in the category of defining the shortest path.
The first step is to transform a map into a graph. For these all-street intersections are considered as vertices and the streets that connect intersections as edges. The edges can have weights that represent either the physical distance between vertices, or the time that takes to travel between them. This graph can be directed showing also the one-way streets in the city.
Now, to give the direction between two points in the map, an algorithm only needs to calculate the path with the lowest sum of edge weights between the two corresponding vertices. This can be trivial for small graphs; however, for graphs created from big cities, this is a hard problem. Fortunately, there are many different algorithms that may not give the perfect solution, but will give a very good approximation, such as the Dijkstra's algorithm or the A* search algorithm.
Finding the shortest or fastest route between two points in the map is definitely one of the most used applications of graph theory. However, there are other applications of the shortest path problem. For example, in social networks, it can be used to study the “six degrees of separation” between people, or in telecommunication networks to obtain the minimum delay time in the network.
Sudoku is a popular puzzle with a 9x9 grid that needs to be filled with numbers from 1 to 9. A few numbers are given as a clue and the remaining numbers needed to be filled follow a simple rule: they cannot be repeated in the same row, column or region. This puzzle, despite using numbers, is not a mathematical puzzle, but a combinational puzzle that can be solved with the help of graph coloring.
One can convert the puzzle to a graph. Here, each position on the grid is represented by a vertex. The vertices are connected if they share the same row, column or region. This graph is an undirected graph, since the relationship between vertices goes both ways. An important feature of the graph is the assignment of a label to each vertex. The label corresponds to the number used in that position. In graph theory, the labels of vertices are called colors.
To solve the puzzle, one needs to assign a color to all vertices. The main rule of Sudoku is that each row, column or region cannot have two of the same numbers, thus two vertices that are connected cannot have the same color. This problem is called graph coloring, and, as with other graph theory problems, there are many different algorithms that can be used to solve this problem (Greedy coloring or DSatur algorithm, for example), but their performance depends highly on the graph itself.
The coloring problem is used normally for very fundamental problems. However, there are more real-life problems that can be translated to a coloring problem, such as scheduling tasks. For example, scheduling exams in rooms. Each exam is a vertex and there is an edge connecting them if it takes place at the same time. The graph created is called an interval graph, and by solving the minimum coloring problem of the graph, you obtain the minimum number of rooms needed for all the exams. This can be generalized with tasks that use the same resources, such as compilers of programming languages or bandwidth allocation to radio stations.
Search engines such as Google let us navigate through the World Wide Web without a problem. Once a query is made to search a specific set of words, the engine looks for websites that match the query. After finding millions of matches, how does the engine rank them to show the most popular ones first?
The search engine solves this through graph theory by first creating a web graph, a graph where the vertices are the websites, and the directed edges follow hyperlinks within those websites. The result is a directed graph that shows all relations between websites. Additionally, one can add weights to the vertices to give priority to more important or influential websites.
To classify the most popular websites, different algorithms can be used. One of the first ones used by Google is called PageRank. Here, the engine assigns probabilities to click a hyperlink and iteratively adds them up to form a probability distribution. This distribution represents the likelihood of a person randomly arriving at a particular website. Then, the engine orders the list of websites according to this distribution and shows the highest ones.
This algorithm had many faults. One can exploit it by having for example blog websites with many links to a particular website to increase the click probability, or by buying hyperlinks in websites with higher weights. Nowadays, there are more complicated algorithms that also consider sponsored advertisement, but the main core is still graph theory and the relations between websites.
In January 2022, Facebook had 2.9 billion active users. As a social media platform, most of the revenue comes from advertising. Having so many users, advertisers will find it very expensive to place their advertising campaigns within the reach of everyone. However, one can also just target the people that may be interested in your product. How can you define such a target audience?
Using graph theory, you can create a social network graph by assigning a vertex to each person. You connect vertices with edges if the persons have a relationship, such as friends in Facebook. This leads to an undirected graph. This massive graph would appear at the beginning very chaotic; however, one can always find patterns in it.
A way to find the ideal target audience is to decompose the graph into smaller sub-graphs. There are different algorithms that can do this, such as hierarchical clustering algorithms or minimum cut methods like the Karger's algorithm. The result is the division of the graph into clusters of people that are highly connected to each other, but less connected to other groups of people. These groups are called communities and they share common interests, like specific artists, brands or even political parties. Identifying these communities is advantageous for advertising since they are more likely to buy common products, follow similar artists or vote for similar parties.
The detection of communities can be also used for other purposes than advertisement. After identifying the communities, one can compare connections between groups or even within groups. If a group or a vertex within the group does not behave as their peers, it can be a sign of intrusion. This can be used as a security control. For example, if the vertices are computers or programs in a network, strange behavior could be caused by attacks on it. Identifying strange connections can improve the security of the network.
Know more about Xomnia, the leading AI consultancy in the Netherlands
In this blog, we went over how graph theory came to live from a simple mathematical puzzle. You now know the main characteristics of the field and the main problems that can be solved using graph theory. However, as an introduction to the field, the main goal of this blog is to encourage the reader to think about problems the way graph theory does: abstract the problem and remove all non-important parts behind. This will make the search for a solution much easier.
Don't miss Xomnia's latest business cases and blogs. Subscribe to our newsletter.

The gap between a compelling GenAI demo and a working production system is wider than most organisations expect. And the reason is almost never the technology.
So you centralise. The right call. One team manages agentic AI. They create rules, stop...

This blog is about getting full control of your data. And it is geared towards data platforms. However, a lot of the more generic remarks will hold up for other types of system environments also.

Modern AI tools have democratized software creation. With the concept of ‘vibe coding’ maturing to ‘agentic engineering’ and some powerful new plugins (or skills, MCP tools and CLI’s), full-stack development is now accessible to a much wider audienc...